Most people would associate two things with libraries - first, an image of shelves stacked neatly with books; second, the distinct smell of old pages which instils in you a wanting for books. There is a word which describes this sensation of enjoying the smell of pages . it’s called bibliosmia. Before the “Amazon” age, the easiest way to read was to go to a library and borrow a book. The advent of the digital age has transformed the way we read and naturally changed the landscape of libraries as well. eBooks and Audibooks are becoming popular formats for reading. It is now possible to borrow digital content from libraries right from home.
In this article I wish to explore the trends in library usage, both old and new if any. In particular, I use the Seattle public library dataset as a representative viewport for library activity. The trends observed might very well not generalize across all libraries or even other libraries in the country for that matter. However, due to lack of such a unified dataset this will have to suffice.
Description of data
As part of the Open Data Program, the Seattle State library provides a dataset of checkouts data containing over 35.1 million records collected since 2005. The library has over 2681971 items which are cataloged [here][1]. The data can be downloaded from the Seattle open data reserves over [here][2].
The dataset consists of checkouts aggregated by month. It also has some meta information such as the type of Material - Ebook, paperback, audiobook etc and also the general information like title, authors and publication year. The entire dataset is about 7GB in size. There’s another version of this dataset which is not aggregated and stores records by each checkout. That version can be found [here][3].
The Hit List
Educated: A memoir, Educated : A memoir, Educated: A memoir / Tara Westover. I’ve tried
to take this into account and reformat them while processing, but in a dataset this large
errors are unavoidable. There are also several unnamed records which have high readership,
but since the title is unknown we will never know what they are.2019 - 10 Most Borrowed
There’s a lot of overlap between the list shown here and the best-selling books of 2019 reported on other websites which provides a comforting sanity check.
- Becoming by Michelle Obama
- Educated: A Memoir by Tara Westover
- Where the crawdads sing by Delia Owens
- The Library Book by Susan Orlean
- The Life-Changing magic of tidying up: the japanese art of decluttering and organizing by Marie Kondo
- You are a badass - How to stop doubting your greatness and start living an awesome life by Jen Sincero
- Little Fires Everywhere by Celeste Ng
- So you want to talk about race by Ijeoma Oluo
- Bad Blood Secrets and Lies in a silicon valley startup by John Carreyrou
- Nine Perfect Strangers by Liane Moriarty
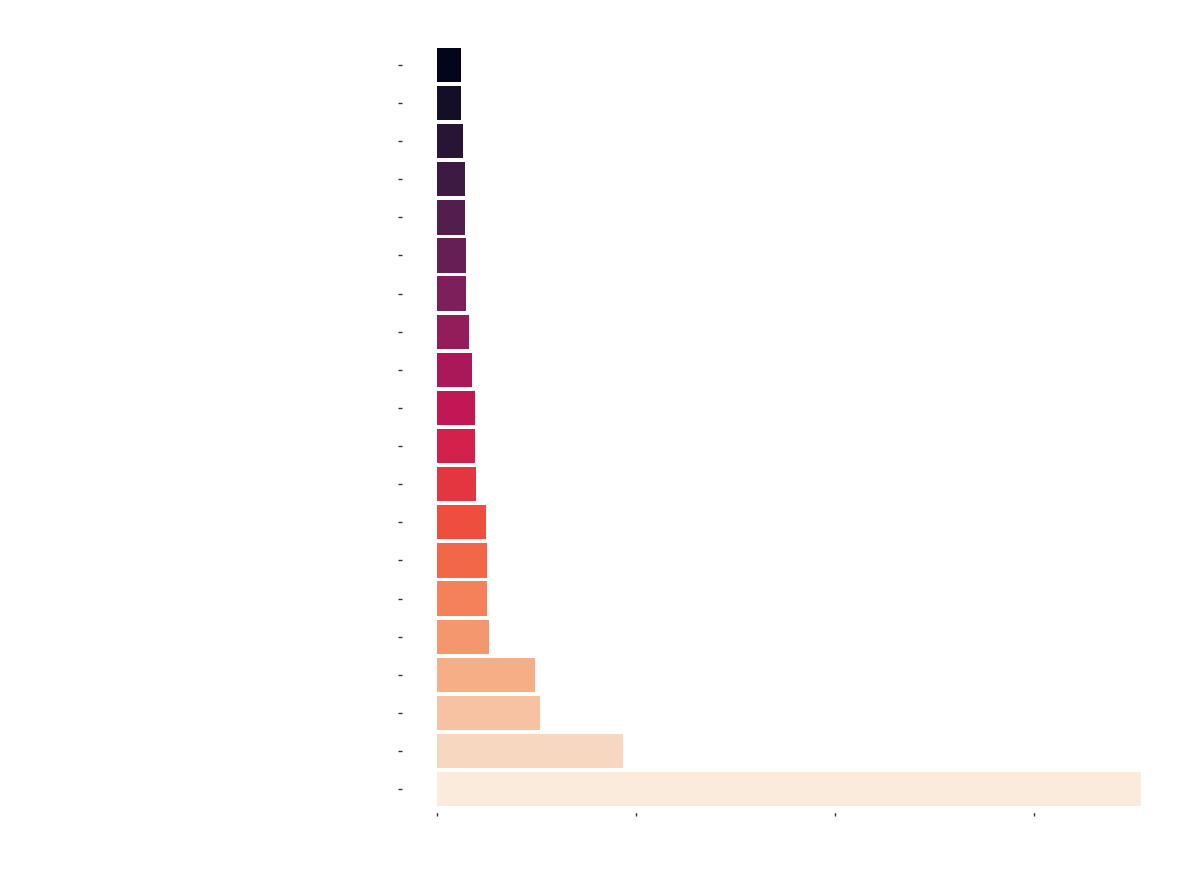
Test of Time
All time highest number of checkouts over the last 15 years !! It is worthy to mention that, Educated: A Memoir by Tara Westover and Becoming by Michelle Obama which take the top spots, where published only in 2018 ! and have amassed so many reads in a year. Educated also features on Bill Gates’s [list of must reads][4]
- Educated: A Memoir
- Becoming
- The Book Thief
- Gone Girl
- Between the World and Me
- All the Light We cannot see
- Ready Player One
- Hillbilly Elegy
- The Goldfinch
- The Help
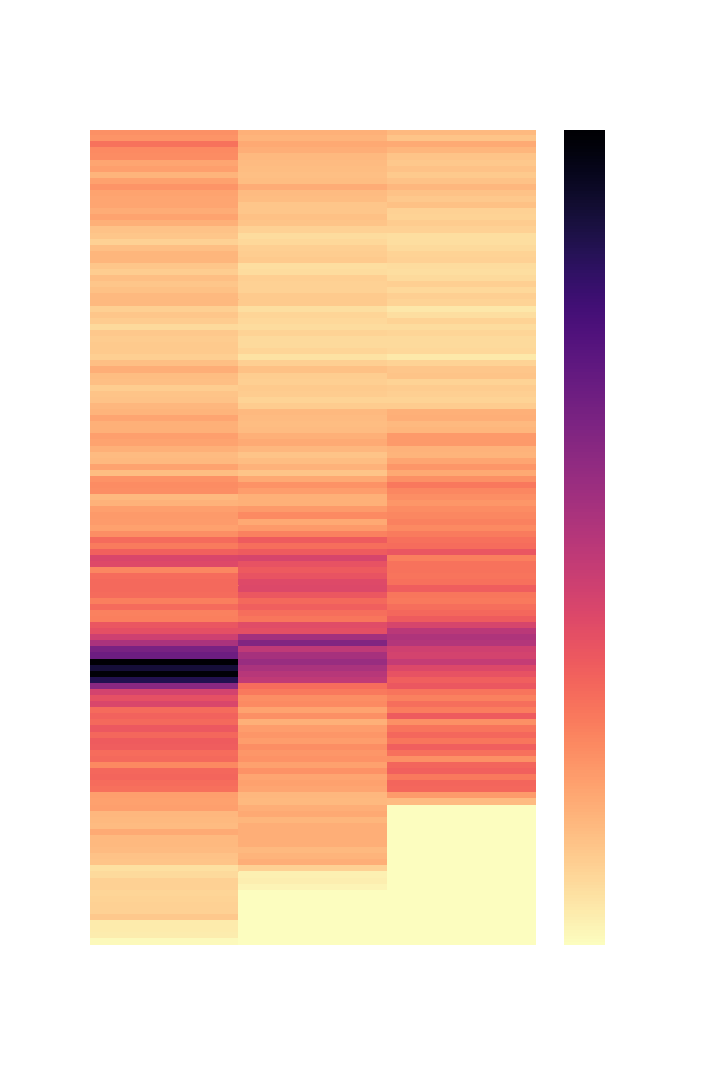
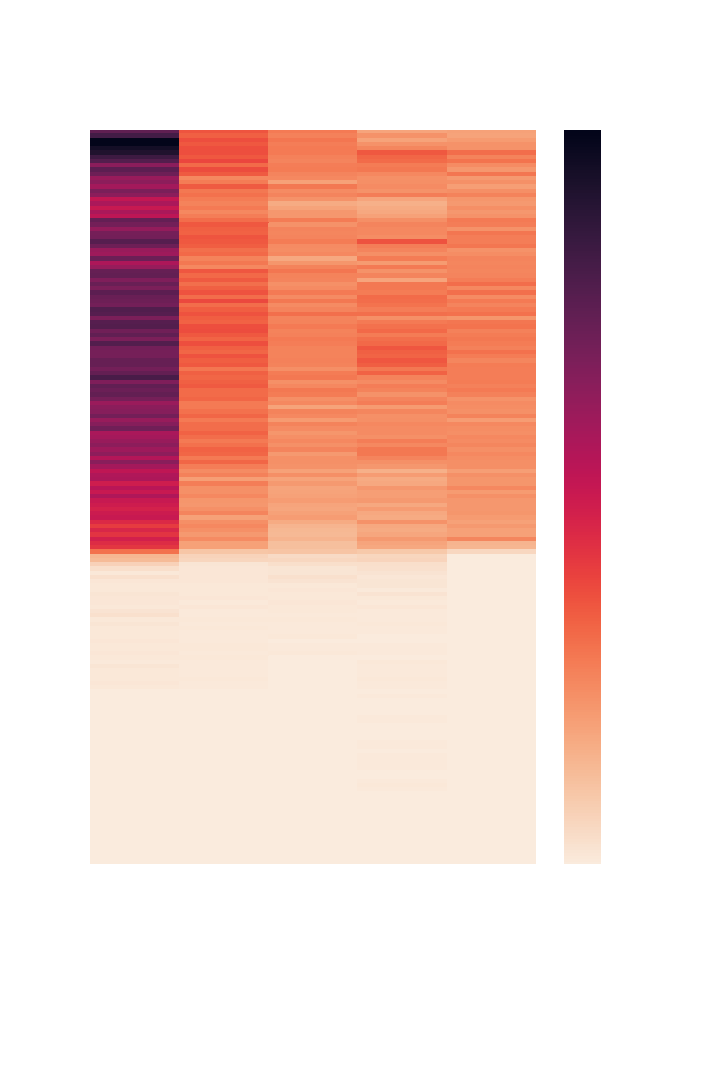
Which is the preferred format for reading ?
The most used format still seems to be the good old Paperback. However, over the last decade things are changing. eBooks and AudioBooks are slowly rising in popularity. In 2005 paperbacks had 99.8% of the share which dropped to 54% in 2019. On the other hand, eBooks and audiobooks which had a meagre 0.12% and 0.06% respectively, increased to 28.7% and 17.15% in 2019.
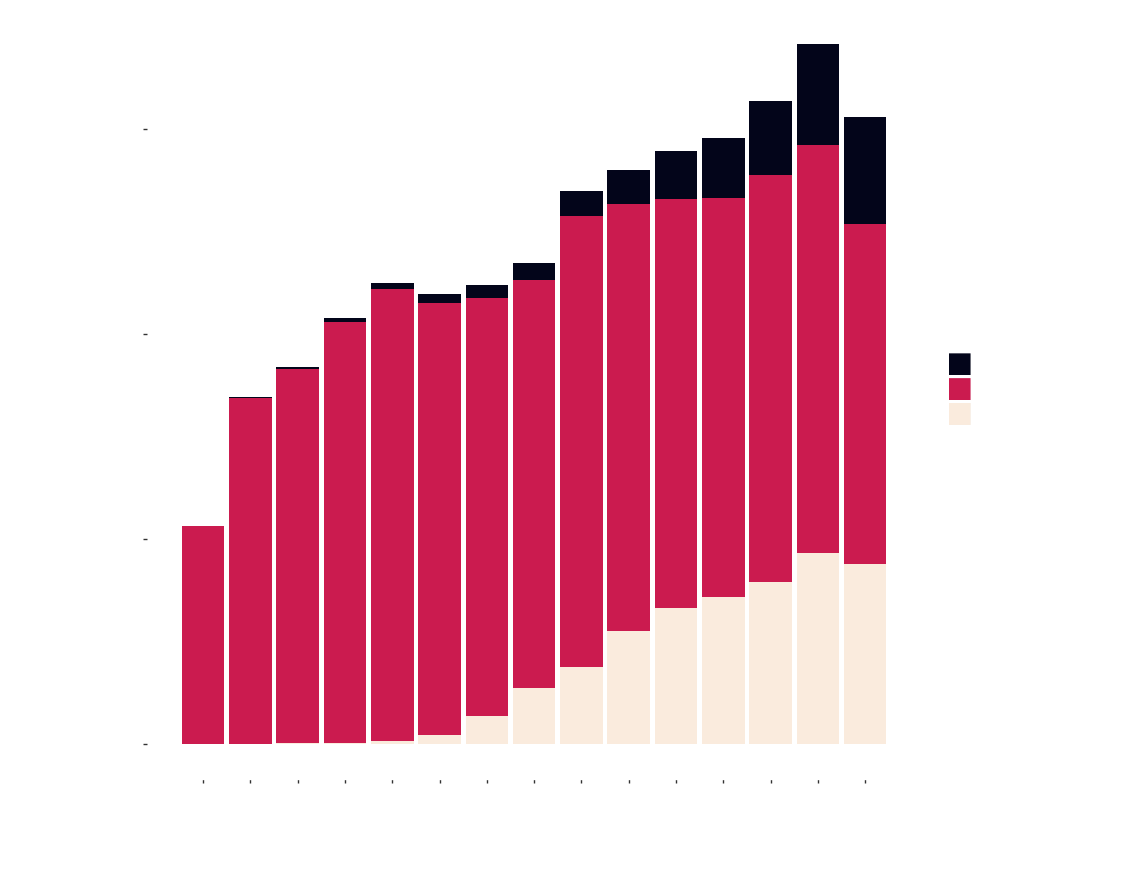
AudioBooks has been rising steadily in popularity - 3% each year and seems to be the future. eBooks which initially seemed to rise by leaps and bounds, has tapered off but is still gaining its way over paperbacks. The popularity of both the digital formats can easily be attributed to Amazon’s foray into digital content. It’s own propietary Kindle ecosystem for eBooks and Audibles for audiobooks have been highly successful.
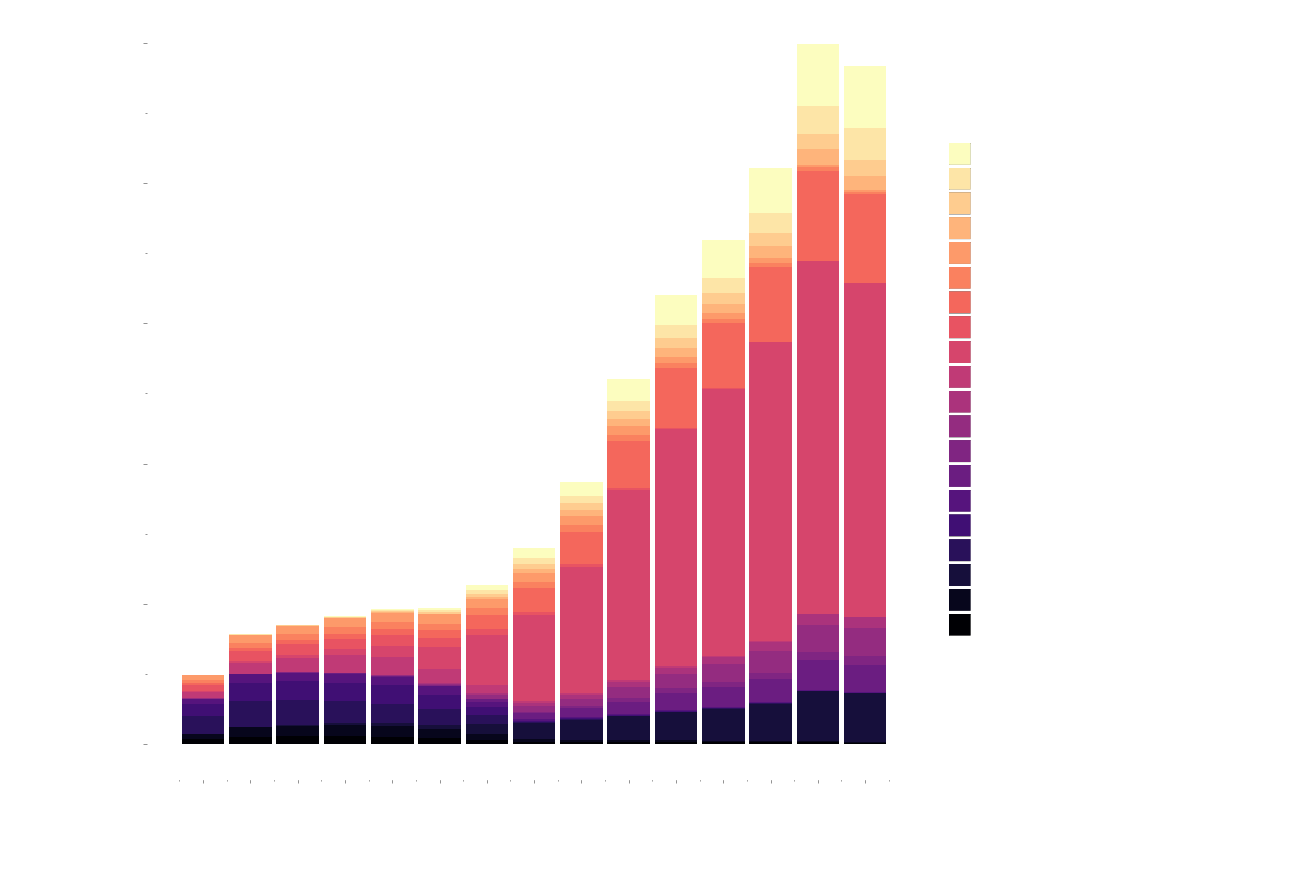
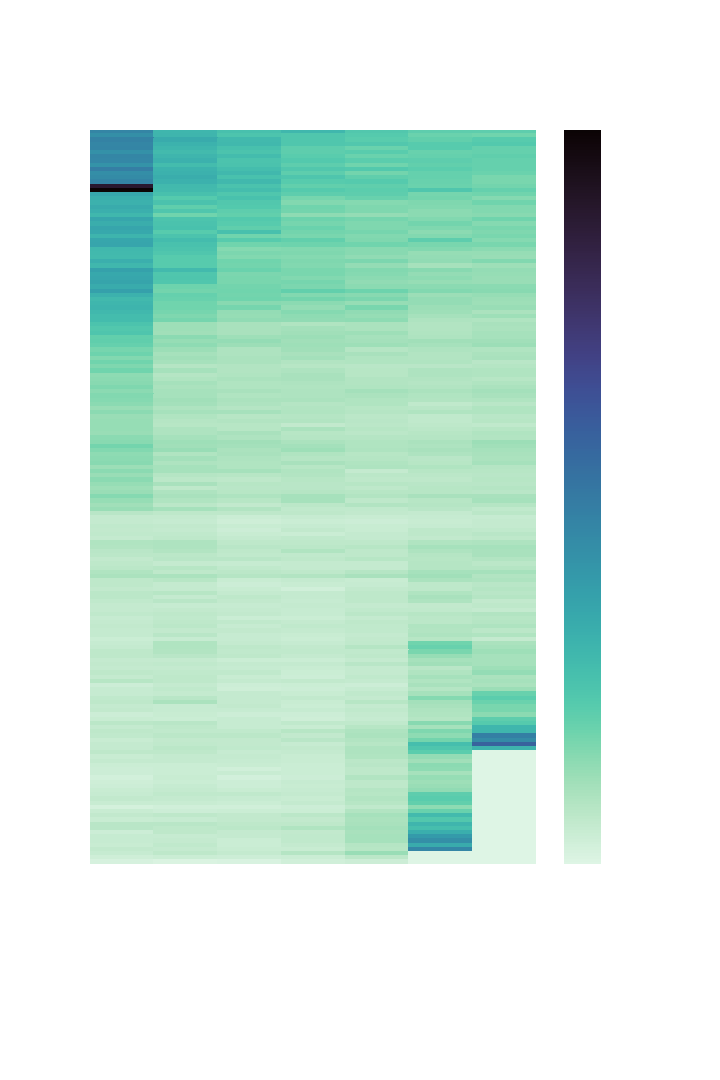
Most popular genres of the decade
Without any surprises Fiction seems to be the most popular genre of the lot. This section of the data analysis isn’t clean. There is no clear genre list and instead each book is tagged with a subject which is basically a summary of the book listing all possible categories. This led to several overlapping sub-categories which I couldn’t distil further. Thus there are several sub-classes and broad categories mixed.
 We still have enough to draw some conclusions though. It is obvious that Fiction has been
the most popular genre over the last several years. The last 5 years have seen a slow rise
in Nonfiction categories as well. Particularly, Business and Biographies have seen a small
but notable increase in readership.
We still have enough to draw some conclusions though. It is obvious that Fiction has been
the most popular genre over the last several years. The last 5 years have seen a slow rise
in Nonfiction categories as well. Particularly, Business and Biographies have seen a small
but notable increase in readership.
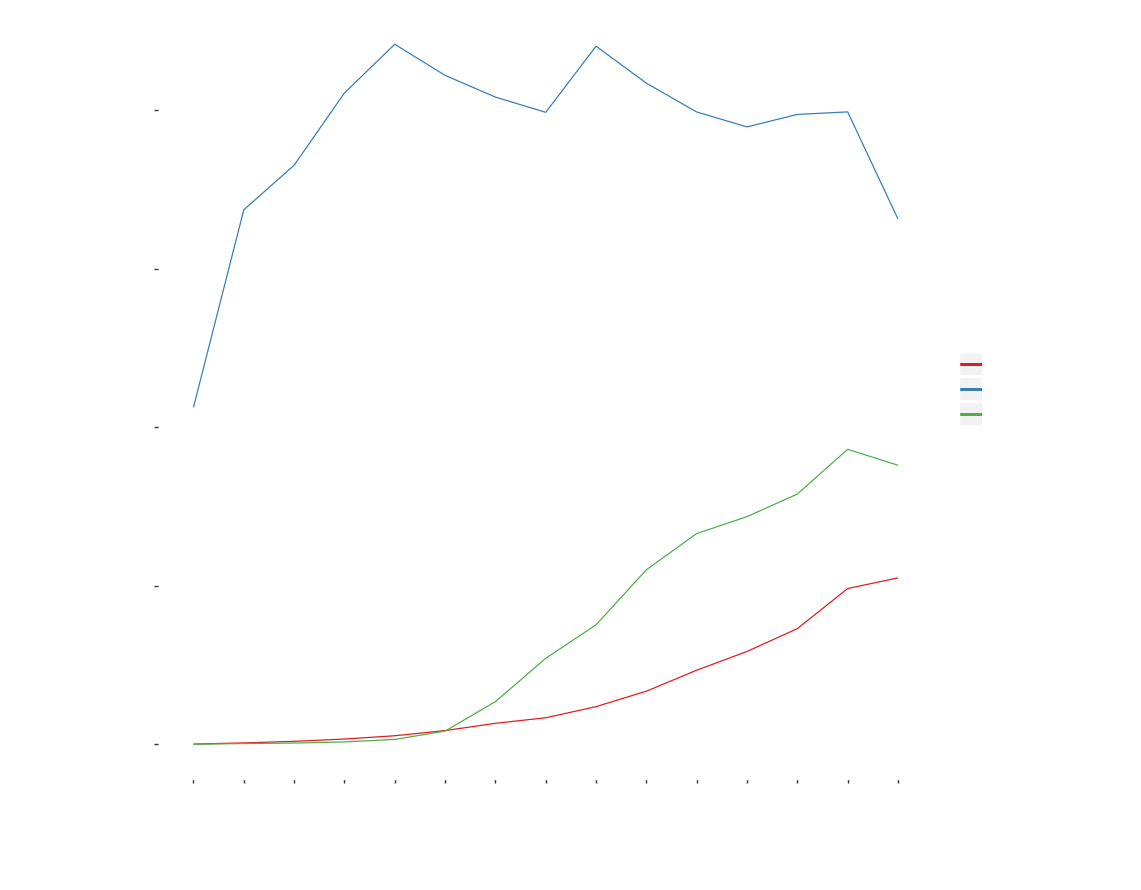
When do people use the library the most ?
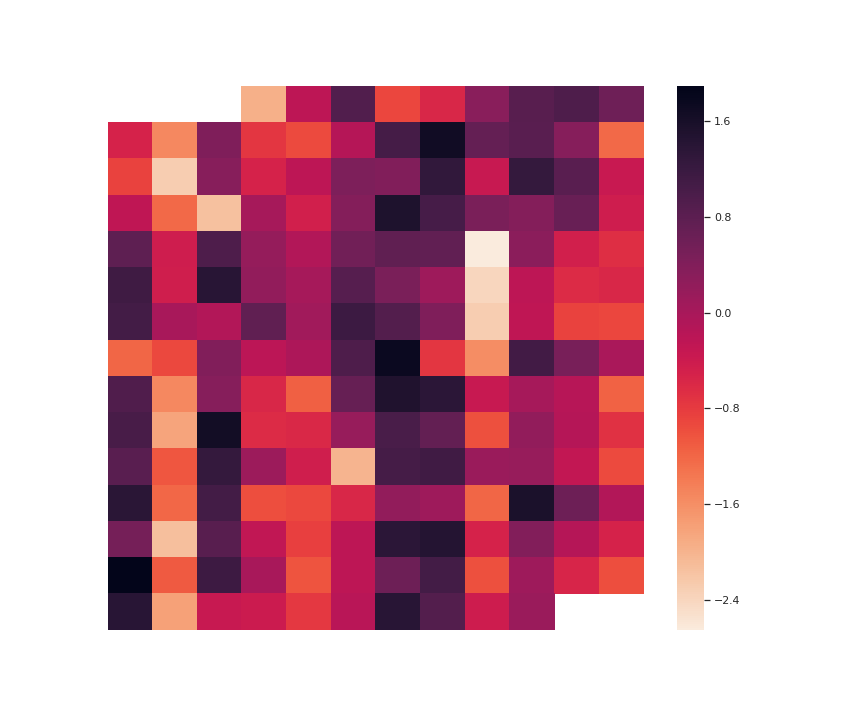
There exists a strong correlation between the month of the year and the checkout activity. The months of Januaryy, March, July and August invariably have the most number of checkouts and the rest of the months exhibit much less activity in comparison. The only exceptions are June and October which rank in between the extremes. This trend is consistent across the last decade.
The correlation arises from the Universities’ schedule in Seattle. Almost all the universities in Seattle - University of Washington, Seattle University etc follow the quarter system which is shown below (Dates are approximate):
- Fall Quarter : Sep 25 - Dec 6
- Winter Quarter : Jan 6 - March 13
- Spring Quarter : March 30 - June 5
- Summer Quarter : Jun 22 - Aug 21
The heatmap below visualizes normalized checkout values as a bivariate function of year and
month. Each box indexed by a month and year, represents the number of books borrowed
for that time period. The shade indicate the magnitude - lighter to darker representing
less to more. It is evident that periods of high usage aligns with the breaks in the school
term or the beginning of it, when students are most likely to borrow books.
Books to Movies
Hunger Games Series
Harry Potter Series
Game of Thrones
Technical Aspects
Pandas to process the data using
small aggregated data frames as required which takes a lot of time. The other challenging
aspect was the textual nature of the data which introduced several String processing
challenges. The jupyter notebook which has all the code is available here.